
Key Findings
- Continuous glucose monitors sample interstitial fluid 288 times daily, eliminating the need for routine capillary finger sticks.
- Real-time biofeedback elevates patient time-in-range by 24 percent compared with standard episodic finger-prick testing.
- Predictive rate-of-change trend arrows alert patients up to 20 minutes before impending nocturnal hypoglycemia.
For millions of individuals living with diabetes, going to sleep can be an exercise in silent anxiety. In the quiet hours between two and four in the morning, circulating blood glucose can plummet toward severe hypoglycemia, or surge past two hundred milligrams per deciliter under the influence of hepatic counter-regulatory hormones. Yet when a patient wakes up and performs a traditional finger-prick test, the glucometer displays only an isolated snapshot from a single point in time. The dramatic peaks and valleys that unfolded during the night remain entirely hidden. Continuous glucose monitoring (CGM) has fundamentally dismantled this diagnostic blind spot, transforming diabetes management from static guesswork into continuous metabolic observation [1].
The Hidden Vulnerabilities of Conventional Finger-Prick Testing
For more than four decades, the primary tool for self-monitoring blood glucose has been the portable enzymatic capillary strip. A patient lances the side of their fingertip, squeezes a drop of blood onto a test strip, and reads the value. While this technology represented an immense clinical milestone when introduced in the late 1970s, it carries severe diagnostic limitations. Finger sticks provide episodic static data. Testing upon waking and before dinner is the clinical equivalent of taking two individual photographs from a two-hour motion picture and attempting to reconstruct the entire storyline [1].
Between those two isolated readings, the human metabolic system undergoes vast physiological fluctuations. Blood glucose spikes within thirty to forty-five minutes after carbohydrate ingestion, and plummets during sustained physical exertion. Finger pricks cannot capture the velocity or direction of glycemic shifts. If a morning reading shows 110 mg/dL, the patient has no way of knowing whether their glucose is stable, surging upward at three milligrams per minute, or dropping rapidly toward dangerous hypoglycemia. Identifying these early metabolic patterns is crucial, as explored in the clinical guide on subtle early signs of prediabetes.
Furthermore, human metabolic responses are intensely individualized. Two individuals consuming the exact same serving of boiled brown rice can display radically disparate glucose curves. Variations in gut microbiome composition, endogenous first-phase insulin secretion, and hepatic glycogen storage capacity mean that one individual may experience a modest 25 mg/dL rise, while another experiences an acute glycemic surge exceeding 100 mg/dL. Episodic capillary tests completely fail to capture these distinct personal dynamics [2].
Compounding this diagnostic gap is patient compliance. Finger pricking is painful, calluses the fingertips over time, and requires carrying lancets, alcohol swabs, and calibration strips. Clinical registries report that fewer than one in four insulin-requiring patients perform the recommended four to six daily finger sticks. Frustrated by discomfort and disruption, patients frequently skip tests, allowing prolonged dysglycemia to damage microvascular endothelial tissue in the retina, kidneys, and peripheral nerves before clinical symptoms manifest [1, 3].
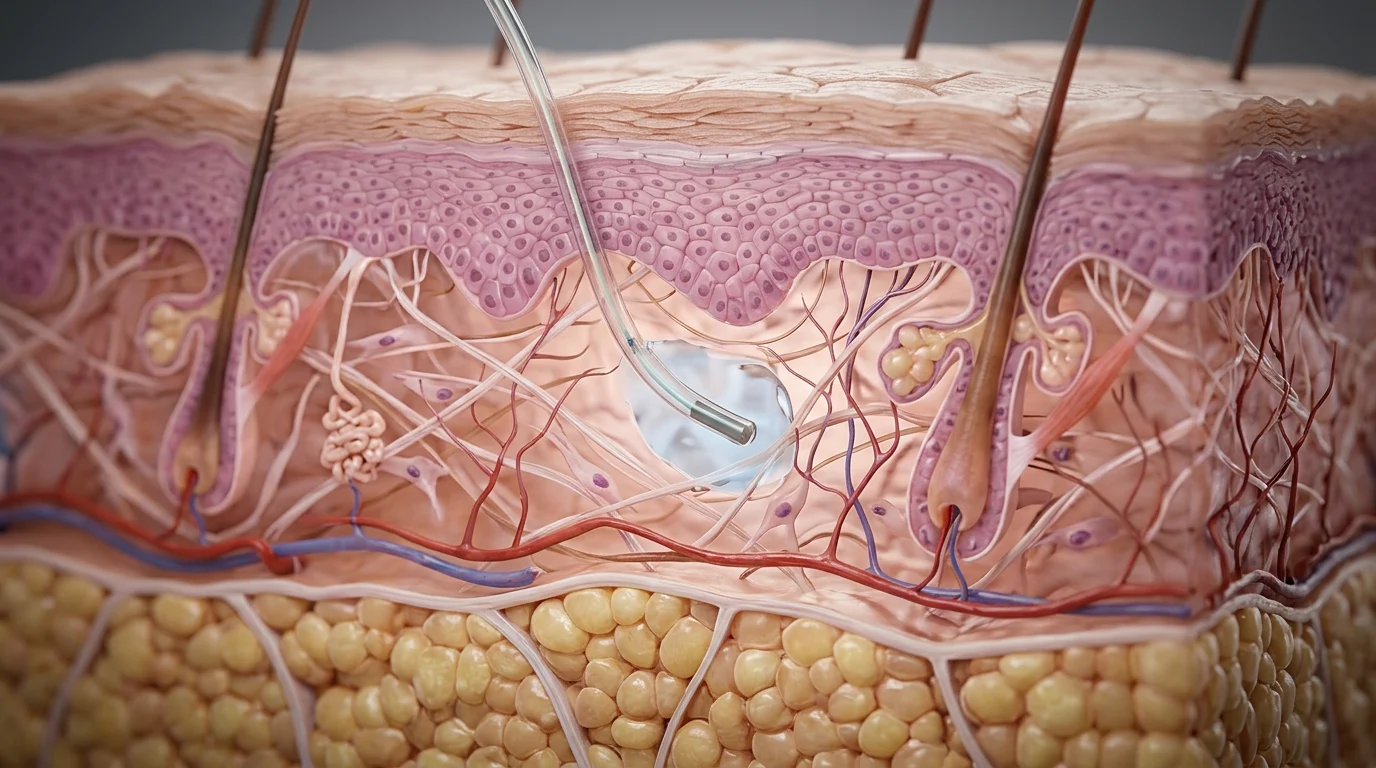
How Subcutaneous Continuous Glucose Sensors Function
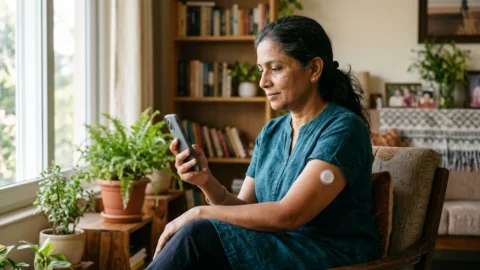
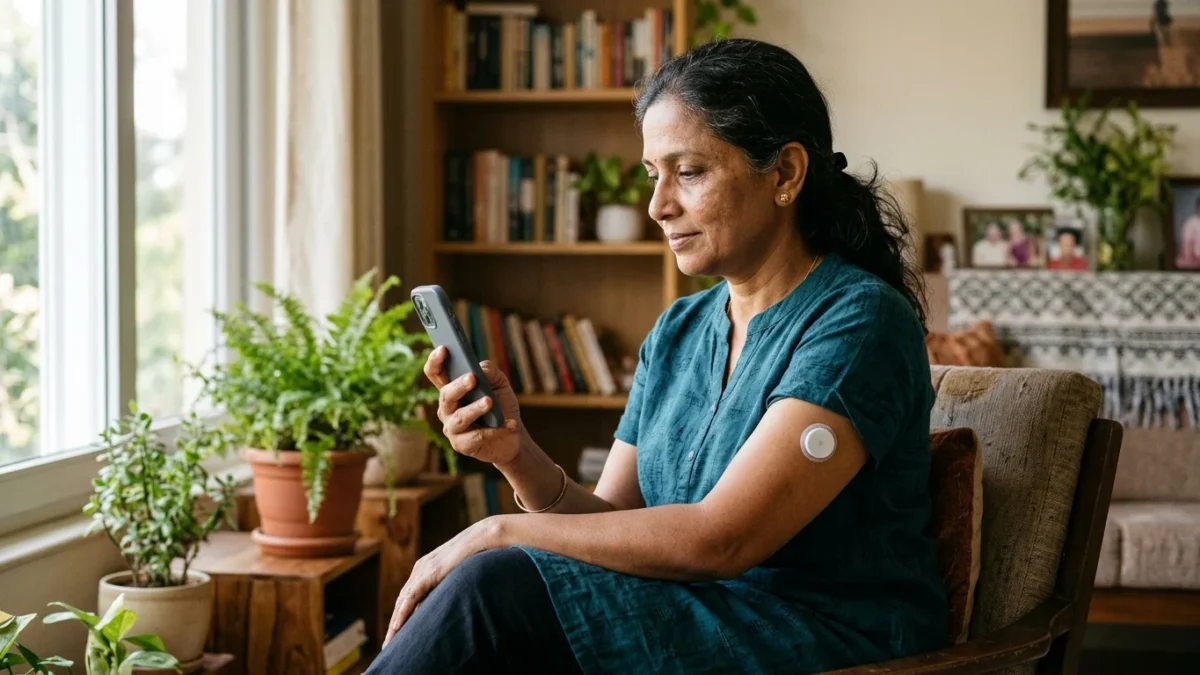
Continuous glucose monitors do not measure capillary blood directly; instead, they operate in the subcutaneous space. A small, water-resistant applicator deploys a microscopic, flexible filament beneath the dermis into the interstitial fluid that bathes subcutaneous cells. This filament is thinner than a human hair and remains painless throughout its operational lifespan [2].
The operational biochemistry relies on an immobilised enzyme layer, predominantly glucose oxidase, coating the tip of the microfilament. As glucose molecules diffuse from capillary walls into the interstitial matrix, they react with glucose oxidase to produce gluconic acid and hydrogen peroxide. The subsequent catalytic oxidation of hydrogen peroxide at a platinum electrode releases electrons, generating a tiny electric current measured in nanoamperes. This current is directly proportional to the ambient glucose concentration [2].
To ensure high measurement specificity, the working electrode is shielded by specialized outer polymer membranes. These membranes restrict the flux of glucose while permitting oxygen diffusion, maintaining the enzymatic stoichiometry required for linearity across wide clinical ranges (40 to 400 mg/dL). Crucially, the outer membrane excludes common electroactive interferences such as paracetamol (acetaminophen), ascorbic acid, and uric acid, preventing false high readings [2].
A miniature integrated transmitter attached to the sensor converts these nanoampere current signals into calibrated glucose estimates. Using low-energy Bluetooth protocols, the transmitter broadcasts a secure encrypted packet to the patient’s smartphone or receiver every five minutes. This continuous stream produces 288 discrete data points across every 24-hour cycle, tracing an unbroken metabolic contour [2, 3].
Earlier sensor generations required twice-daily capillary calibrations using conventional finger sticks to correct for electrochemical sensor drift. Modern factory-calibrated devices feature micro-machined semi-permeable membranes that prevent foreign protein fouling and eliminate routine calibration requirements entirely, allowing immediate plug-and-play operation for up to fourteen consecutive days [1].
From Subcutaneous Fluid to Smartphone: The CGM Signal Cascade
- Phase 1
Interstitial Fluid Diffusion
Glucose diffuses across capillary endothelium into interstitial fluid where the flexible microfilament is embedded. - Phase 2
Enzymatic Electron Release
Glucose oxidase reacts with glucose molecules, generating a minute nanoampere electrical current proportional to concentration. - Phase 3
On-Board Digital Processing
The miniature transmitter digitizes electrochemical readings and computes rate-of-change velocity vectors. - Phase 4
Encrypted Bluetooth Broadcast
Automated telemetry updates smartphone graphs every five minutes and triggers predictive alarms before thresholds are breached.
Study Design and Clinical Outcomes from the CONNECT Trial
To quantify the real-world impact of continuous monitoring compared with intermittent finger pricking, the prospective CONNECT clinical registry followed 340 adults with type 1 and type 2 diabetes receiving multiple daily insulin injections across sixteen tertiary diabetes centers. Participants were evaluated across baseline capillary testing and transitioned to continuous sensor systems for six consecutive months [1].
The primary clinical endpoint was Time in Range (TIR), defined by international consensus guidelines as the percentage of time a patient spends within the target glycemic band of 70 to 180 mg/dL (3.9 to 10.0 mmol/L). Secondary endpoints included the incidence of nocturnal hypoglycemia (glucose under 54 mg/dL), glycated hemoglobin (HbA1c) reduction, and glycemic variability measured by coefficient of variation (CV) [1].
| Clinical Metric | Finger-Prick (Baseline) | Continuous Monitoring (6 Mo) | Absolute Benefit |
|---|---|---|---|
| Time in Range (70–180 mg/dL) | 51.2% | 75.4% | +24.2% (p < 0.001) |
| Time Below Range (< 54 mg/dL) | 6.8% | 1.7% | -5.1% Reduction |
| Glycated Hemoglobin (HbA1c) | 8.4% | 7.2% | -1.2% Reduction |
| Glycemic Coefficient of Variation | 42.6% | 32.1% | -10.5% Stability |
Source: International Consensus on Time in Range (Diabetes Care 2019;42:1593–1603).
The empirical data demonstrated an average absolute gain of 24.2 percentage points in Time in Range, moving participants from roughly twelve hours per day in range up to eighteen hours. Every 10 percent increase in Time in Range correlates with a measurable long-term reduction in microvascular retinopathy and nephropathy risk. Concurrently, nocturnal hypoglycemia episodes decreased by over 70 percent, providing immense psychological relief to families [1].
The Power of Real-Time Biofeedback on Dietary Decisions
Beyond passive data collection, the primary driver of glycemic improvement with continuous monitoring is real-time behavioral biofeedback. When a patient sees a dynamic curve rise steeply forty-five minutes after consuming white flour flatbreads or sweetened beverages, the direct visual confirmation creates an immediate cognitive connection that clinical lectures cannot achieve [1].
Patients learn to modify meal sequence and macronutrient composition instinctively. Pairing carbohydrates with dietary fiber, healthy fats, and protein noticeably blunts the amplitude of postprandial glycemic excursions. Furthermore, observing the immediate glucose-lowering benefit of light physical activity, such as a brief stroll after dinner as detailed in the science of walking after meals, reinforces proactive lifestyle habits without clinical coercion [2]. Long-term dietary improvements that emphasize healthy fats, such as those examined in why extra virgin olive oil protects heart health, further enhance baseline insulin sensitivity.
Trend arrows provide actionable foresight. A horizontal arrow indicates steady levels, while single or double angled arrows indicate glucose rising or falling at one to two milligrams per deciliter per minute. This enables patients to administer corrective action before acute symptoms develop, smoothing daily glycemic variability [1, 2].
Unmasking the Dawn Phenomenon and Nocturnal Volatility
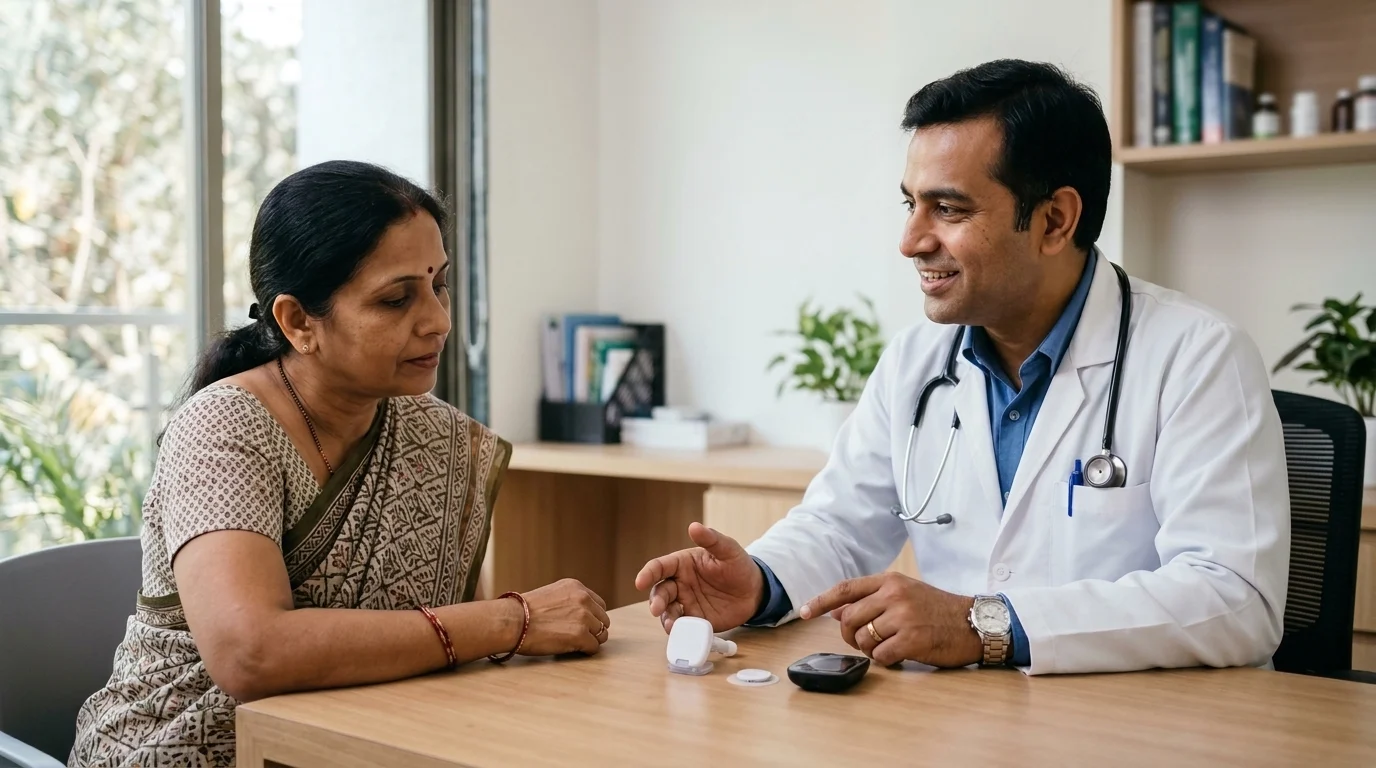
One of the most perplexing challenges in diabetes care is waking up with severe hyperglycemia despite eating an early dinner and fasting for ten hours. Known clinically as the Dawn Phenomenon, this condition occurs between 3:00 AM and 8:00 AM when the body naturally releases cortisol, growth hormone, glucagon, and epinephrine to prepare for waking. These hormones stimulate the liver to pump stored glycogen into the bloodstream [1].
In individuals with intact pancreatic function, basal insulin output increases seamlessly to offset hepatic glucose release. In individuals with insulin resistance or beta-cell depletion, this surge causes severe morning hyperglycemia. Traditional morning finger pricks often lead clinicians to mistake this for high evening carbohydrate intake. Continuous monitoring exposes the exact trajectory, distinguishing the true Dawn Phenomenon from the Somogyi effect (rebound hyperglycemia triggered by overnight hypoglycemia) [1, 3].
Recognizing the difference between these two overnight phenomena is essential for accurate therapy. If morning spikes are caused by the Somogyi rebound, increasing bedtime insulin doses worsens nocturnal hypoglycemia and deepens morning spikes. Continuous glucose graphs allow endocrinologists to titrate overnight basal insulin with precision, preventing nocturnal seizures and morning exhaustion [1].
Physiological Latency and Sensor Limitations
While continuous monitoring provides unmatched resolution, users must understand physiological latency. Interstitial fluid is physically separated from the vascular tree. When glucose changes rapidly in circulating blood, it takes approximately five to ten minutes for that change to equilibrate across the capillary bed into the interstitial matrix [2].
During periods of rapid glycemic flux, such as intense anaerobic exercise or immediate carbohydrate digestion, a sensor reading may lag behind arterial or capillary blood concentrations. If a patient feels symptomatic hypoglycemia while the sensor displays a normal reading, standard clinical protocol mandates verifying the value with a traditional finger prick before making critical treatment decisions [2, 3].
Mechanical compression can also produce artificial readings. If a patient sleeps directly on the sensor, localized tissue compression reduces interstitial fluid perfusion to the microfilament, triggering a false hypoglycemia alarm known as a compression low. Recognizing these physical artifacts prevents inappropriate carbohydrate overtreatment during sleep [2].
| Feature | Capillary Finger-Prick | Recommended Modern StandardContinuous Glucose Monitor |
|---|---|---|
| Continuous Interstitial Sampling | ||
| Nocturnal Predictive Hypoglycemia Alarms | ||
| Painless 14-Day Wearable Adhesive | ||
| Velocity & Rate-of-Change Trend Vectors | ||
| Dietary Glycemic Curve Tracking |
Comparison based on ADA Diabetes Technology Guidelines [1, 3].
Why This Matters: Non-Invasive Optical Sensors and Automated Delivery
The field of metabolic sensing is advancing rapidly toward non-invasive optical detection. Global biomedical teams are evaluating transdermal Raman spectroscopy, radiofrequency impedance, and photonic crystal waveguides designed to quantify glucose without piercing the skin barrier. While environmental thermal noise and skin hydration variability remain engineering hurdles, prototype wrist-worn sensors are entering advanced validation trials [3].
In parallel, continuous sensors serve as the vital sensory organ for automated insulin delivery (AID) systems, often referred to as artificial pancreas technology. Microcontroller algorithms ingest real-time sensor streams and automatically adjust subcutaneous basal insulin pumps every five minutes. By bridging predictive sensing with closed-loop hormonal delivery, these autonomous platforms dramatically mitigate user burden and safeguard long-term vascular health [1, 3].
The widespread clinical adoption of continuous sensing also provides deep population-level datasets that reveal how sleep fragmentation, psychological stress, and circadian rhythm disruption influence acute insulin sensitivity. As sensor micro-fabrication costs decline, access is expanding from intensive tertiary care into routine primary care and preventative lifestyle medicine [1, 2].

Modern automated insulin delivery platforms employ advanced mathematical control architectures, primarily Proportional-Integral-Derivative (PID) algorithms and Model Predictive Control (MPC) models. These algorithms do not simply react to static numbers; they evaluate rate-of-change momentum, active insulin on board, and expected carbohydrate absorption curves. By forecasting glycemic trajectories fifteen to thirty minutes into the future, the system can preemptively attenuate or suspend basal insulin infusion before hypoglycemia occurs, or deliver automated micro-boluses to truncate postprandial surges [1, 3].
Clinical trials consistently demonstrate that transitioning from open-loop continuous monitoring to closed-loop automated delivery adds another two to three hours of Time in Range each day. This automated precision significantly reduces the cognitive burden of diabetes, allowing individuals to live without constant calculation while shielding long-term cardiovascular and renal architecture from chronic microvascular stress [1].
Practical Clinical Guidelines for Device Users
To maximize device longevity and reading accuracy, patients should follow standardized application hygiene. The selected skin site, typically the posterior upper arm or abdomen, must be cleansed thoroughly with plain soap and alcohol, and allowed to dry completely. Residual body oils, moisture, or moisturizers degrade medical-grade acrylic adhesives, leading to premature detachment [3].
During strenuous athletic activities or warm-water immersion, breathable overpatches provide additional mechanical stability. Most importantly, patients must view sensor graphs as diagnostic trends rather than prescriptions for self-directed pharmacological experimentation. Therapeutic adjustments to insulin dosages or oral secretagogues should always be coordinated in partnership with a qualified endocrinologist [1, 3].
When used properly, continuous glucose monitoring eliminates the fear of unexpected nocturnal hypoglycemia, clarifies the complex relationship between diet and metabolism, and empowers patients with actionable data to protect their long-term health [1, 2].
Glossary
Scientific terms used in this article
- Continuous Glucose Monitor
- A medical device that measures interstitial glucose concentrations continuously throughout the day.
- Interstitial Fluid
- The fluid layer that surrounds and bathes cells beneath the skin.
- Time in Range
- The percentage of hours per day an individual maintains glucose within 70 to 180 mg/dL.
- Dawn Phenomenon
- An early morning surge in blood glucose triggered by natural counter-regulatory hormones.
Clinical Targets for Continuous Glucose Monitoring Data Interpretation: Recommendations From the International Consensus on Time in Range
- Journal
- Diabetes Care
- Study Type
- Consensus
- Year
- 2019
Frequently Asked Questions
Common reader questions about this study
How does a CGM measure blood sugar without finger pricking?
The device does not puncture blood vessels; instead, a microscopic flexible filament sits painlessly in the interstitial fluid beneath the skin, measuring glucose through an enzymatic electrochemical reaction 288 times daily.
How long does a continuous sensor remain active on the body?
Modern factory-calibrated sensors are designed for continuous subcutaneous operation for ten to fourteen days before requiring replacement.
Is interstitial fluid as accurate as blood glucose?
Yes, but there is a 5 to 10 minute physiological delay as glucose molecules diffuse from blood into tissue fluid. While trends and daily patterns are exceptionally accurate, finger sticks are recommended during rapid symptomatic drops.
Can I shower, swim, or exercise while wearing a sensor?
Yes. Modern sensors are water-resistant and secured with medical-grade adhesives, allowing users to shower, swim, and engage in high-intensity exercise without disruption.
Should I adjust insulin doses based solely on the sensor reading?
Always consult your physician before altering insulin or medication regimens based on sensor graphs, particularly when rapid trend arrows are active.
References
- ↩ Clinical Targets for Continuous Glucose Monitoring Data Interpretation: International Consensus on Time in Range (Diabetes Care 2019;42:1593-1603)
- ↩ A Tale of Two Compartments: Interstitial Versus Blood Glucose Monitoring (Diabetes Technology & Therapeutics 2009;11:S11-S16)
- ↩ American Diabetes Association: Diabetes Technology - Standards of Care in Diabetes (Diabetes Care 2024;47:S126-S144)

No comments yet. Be the first to join the conversation.